The Office of Institutional and Academic Insights (IAI)
Institutional Data
SCU utilizes Microsoft Power BI to create a visually appealing and interactive representation of key institutional data, including student enrollment, retention, and graduation outcomes. This powerful tool allows users to explore trends over time, compare metrics across different student groups, and gain deeper insights into performance indicators. Data can be easily disaggregated by a variety of demographic characteristics—such as race/ethnicity, gender, age, and program of study—supporting informed decision-making, continuous improvement, and strategic planning across the university.

- Admissions
- Enrollment
- Degrees Awarded
- Financial Aid: Average Amount | Dollars Awarded | Number of Awards
- Employee Information
- Faculty: Fall 2022 | Spring 2023 | Summer 2023 | Fall 2023
The SCU Fast Facts provide users with concise information on a range of university statistics from enrollment to diversity in a easy to read to format.

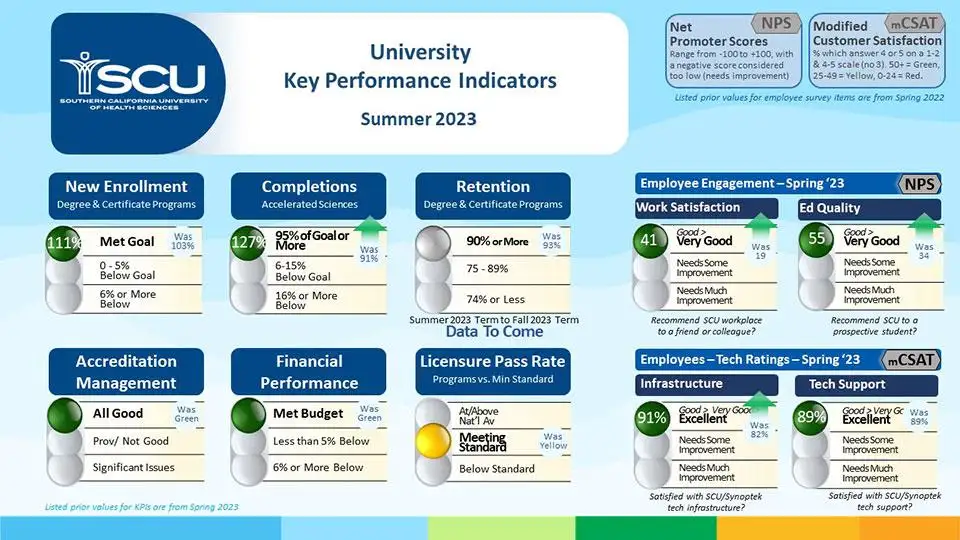
The SCU Board of Regents has adopted a set of University “Key Performance Indicators” or KPIs. These are the data that they are focusing on in their big-picture view of the strategic position of the University.
The current list consists of:
- New enrollments in Degree and Certificate Programs
- Accelerated Sciences Course Completions
- Retention
- Accreditation Management
- Financial Performance
- Licensure Pass Rate
- Student Satisfaction (Fall Only)
- Employee Engagement (Spring Only)
- Employee and Student Satisfaction with Technology Support and Infrastructure
Employee engagement and Student Satisfaction are reported using “Net Promoter Scores” or NPS – a method published in a Harvard Business Review article that asks raters to say how likely they are to recommend the product or service to a friend on a ten-point scale. They then create a ratio of the number responding with a 9 or 10 divided by the number responding 1 through 6. Responses of 7 or 8 are not considered. The resulting fraction is the Net Promoter Score.
Employee and student satisfaction is reported using the Customer Satisfaction or CSAT score. This is simply the fraction of respondents who indicated a 4 or a 5 on a five-point Likert scale–e.g. agree and strongly agree.
The SCU enrollment report provides a detailed roll forward of the actual, forecasted, and budgeted student counts used to prepare each month’s financial reporting package.
Understanding the Enrollment Report
2020: August
2021: August
2022: August | October | November | December
2023: January | February | March | April | May | June | July | August | September | October | November | December
2024: January | February | March | April | May | June | July | August | September | October | November | December
- About IPEDS
- Annual Data Feedback Reports: 2020 | 2021
IPEDS Reports
- Winter 2021: Outcome Measures | Student Financial Aid
- Spring 2021: Finance | Human Resources | Academic Libraries
- Fall 2021: 12-Month Enrollment | Completions | Institutional Characteristics
- Winter 2022: Financial Aid | Graduation Rates | Outcome Measures
- Spring 2022: Academic Libraries | Fall Enrollment | Finance | Human Resources
- Spring 2023: Academic Libraries | Fall Enrollment | Finance | Human Resources
